plot_pcs()
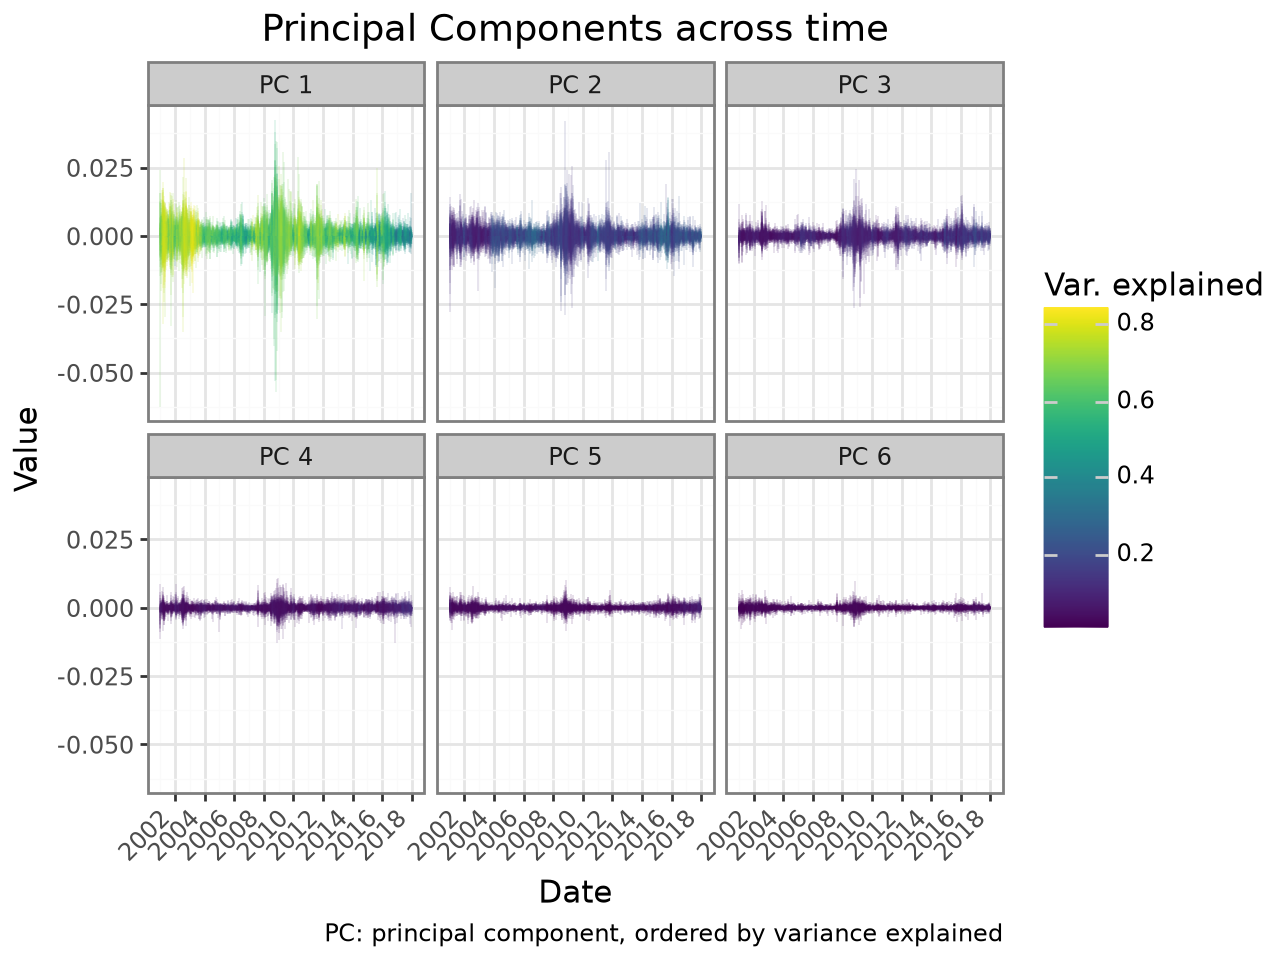
Plot the principal component trajectories colored by explained variance.
Usage
plot_pcs(
    pca,
    merge_blocks=1,
)
Example with high-frequency factor zoo data from Aleti 2022:
Parameters
pca: PCAHighFreqResult-
The result of pca_high_freq.
merge_blocks: int = 1-
Number of blocks to merge (sum) in a single observation for plotting. This is useful to reduce the number of points in the plot and improve visibility.
Returns
ggplot-
A [ggplot][plotnine.ggplot] object. Print the object to show the plot,
or save it with
plotnine.ggsave. Modifications can be made by addingplotnine calls to the result:
plot_loadings(...) + plotnine.*(...).