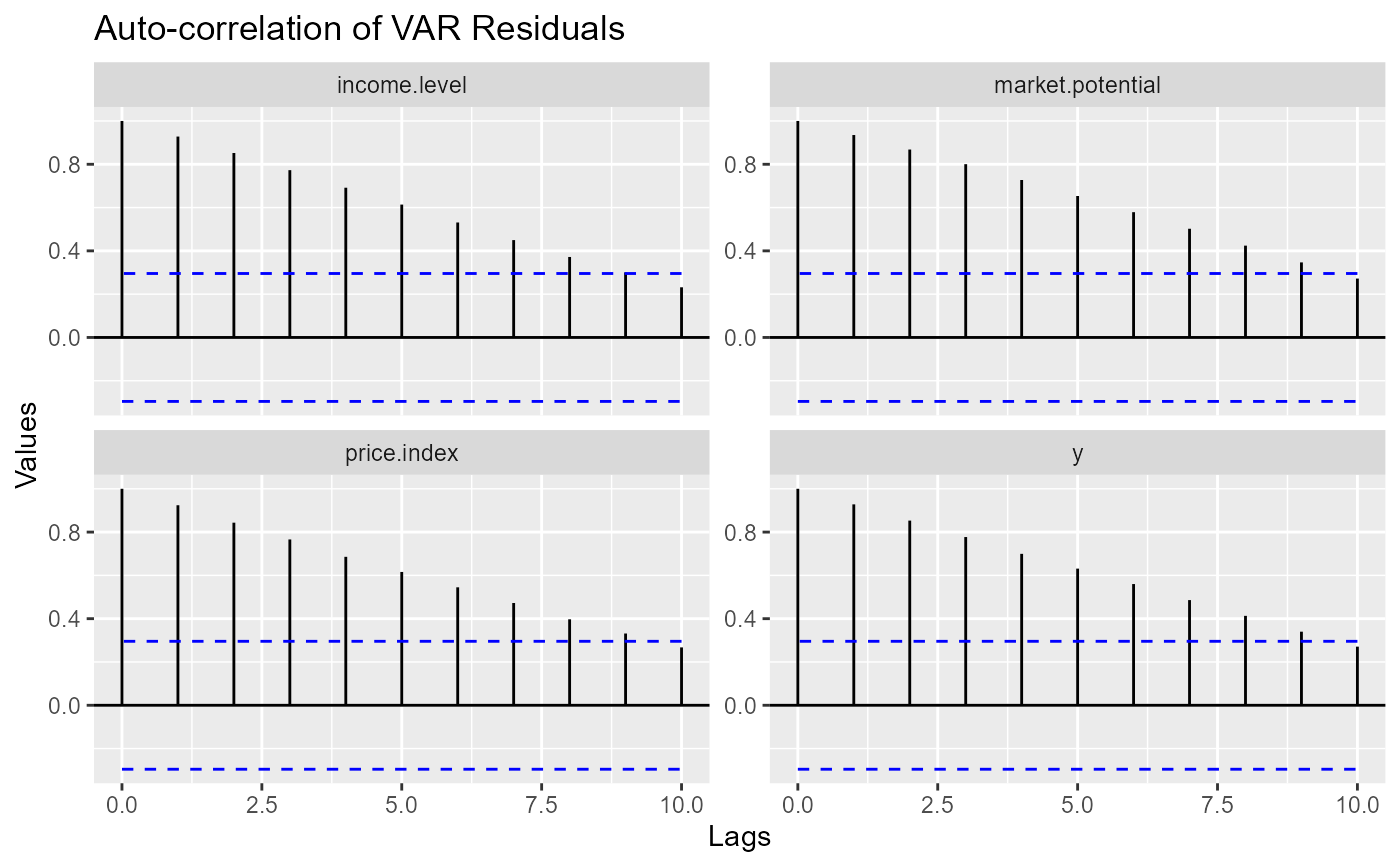
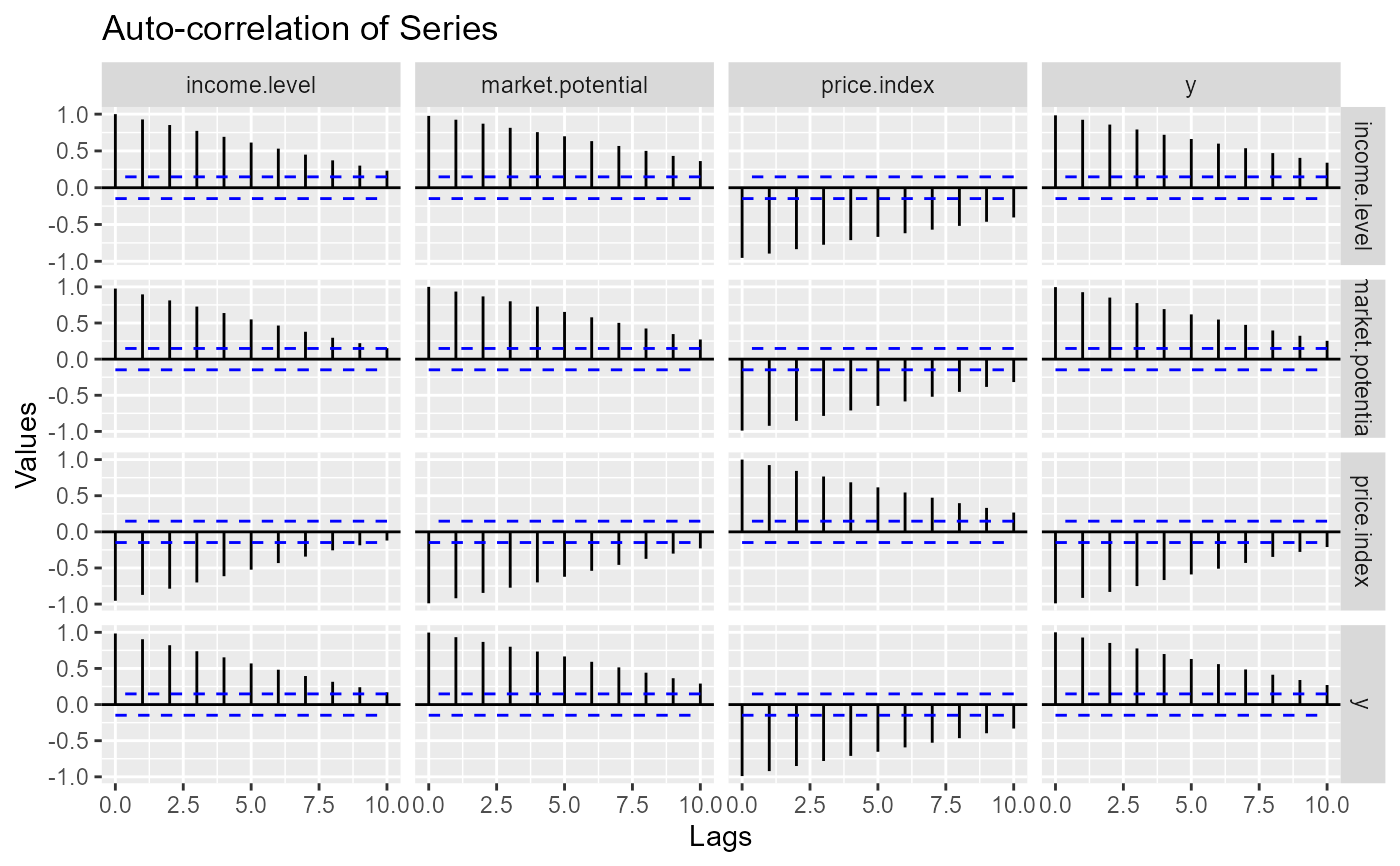
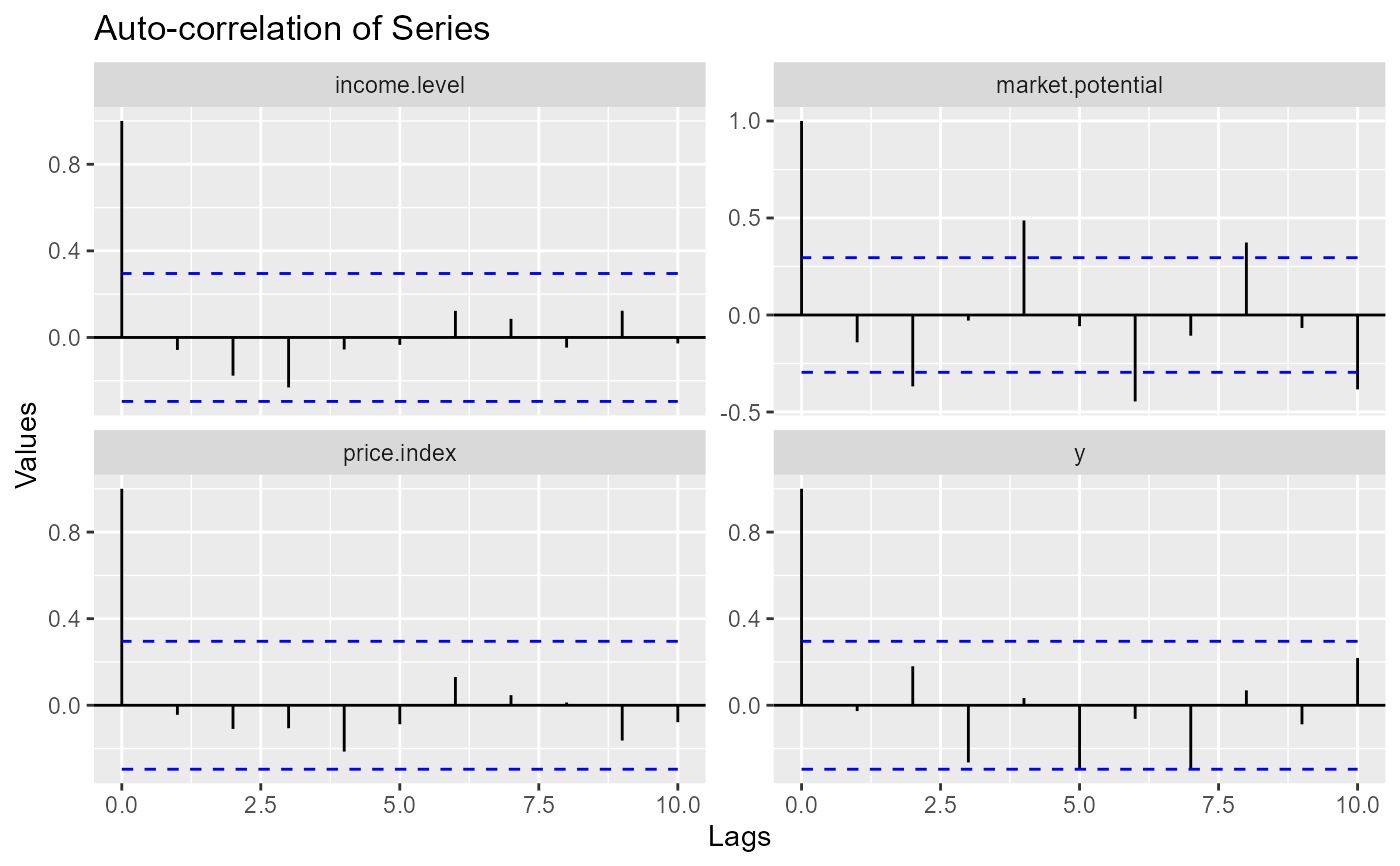
Given a dataset or VAR model to get residuals from, ggvar_acf plots the
auto-correlations (and similar) call for every series. ggvar_ccf plots all
the cross-correlations (and similar) between the series, in a grid.
Usage
ggvar_acf(
  x,
  series = NULL,
  lag.max = NULL,
  type = "correlation",
  graph_type = "segment",
  args_type = list(),
  args_ribbon = list(linetype = 2, color = "blue", fill = NA),
  args_hline = list(yintercept = 0),
  args_labs = list(),
  args_facet = list(),
  ci = 0.95,
  ...
)

ggvar_ccf(
  x,
  series = NULL,
  lag.max = NULL,
  type = "correlation",
  graph_type = "segment",
  args_type = list(),
  args_ribbon = list(linetype = 2, color = "blue", fill = NA),
  args_hline = list(yintercept = 0),
  args_labs = list(),
  args_facet = list(),
  facet_type = "ggplot",
  ci = 0.95,
  ...
)
Arguments
- x
A dataset (object coercible to "data.frame") or a "varest" object to get residuals from.
- series
A character vector with series (variables) to consider. Defaults to all (
NULL).- lag.max
The number of lags used to calculate the ACF, passed to acf.
- type
The type of ACF to be computed. Can be either "correlation", "covariance", or "partial". Passed to acf.
- graph_type
The ggplot geom used to create the plot: texts_vec.
- args_type
Arguments passed to the 'geom' chosen in
graph_type.- args_ribbon, args_hline
Additional arguments passed to geom_ribbon and geom_hline (respectively). See more in the 'Customization' section.
- args_labs
Additional arguments passed to labs. If an empty list, will be changed to default values.
- args_facet
Additional arguments passed to the faceting engine used.
- ci
The confidence level for the confidence interval. Set to
FALSEto omit. Used in geom_ribbon.- ...
Arguments passed to methods, see the 'Methods' section.
- facet_type
The facet 'engine' to be used.
'ggplot2'for ggplot2::facet_grid,'ggh4x'for ggh4x::facet_grid2.
Value
A ggplot.
Details
Customization
The graph can be customized both with the 'static' arguments passed to each layer – using the args_* arguments –, and, if applicable, the 'dynamic' aesthetics – using the args_aes argument.
After built, the result can be further customized as any ggplot, adding or overwriting layers with the ggplot's +. It is useful to understand the data and the mappings coded by the package, using the function get_gg_info.
See vignette('customizing-graphs') for more details.
Methods
The data from x is extracted with the generic function texts_vec. Each class conditions an external function to pass the ... arguments to. Below there is a list with all the currently implemented classes:
Class
'varest': passed to stats::acf.Class
'default': passed to stats::acf.
See also
Other general time series plots:
ggvar_distribution(),
ggvar_history()
Other model diagnostics plots:
ggvar_dispersion(),
ggvar_distribution(),
ggvar_history(),
ggvar_select(),
ggvar_stability()


