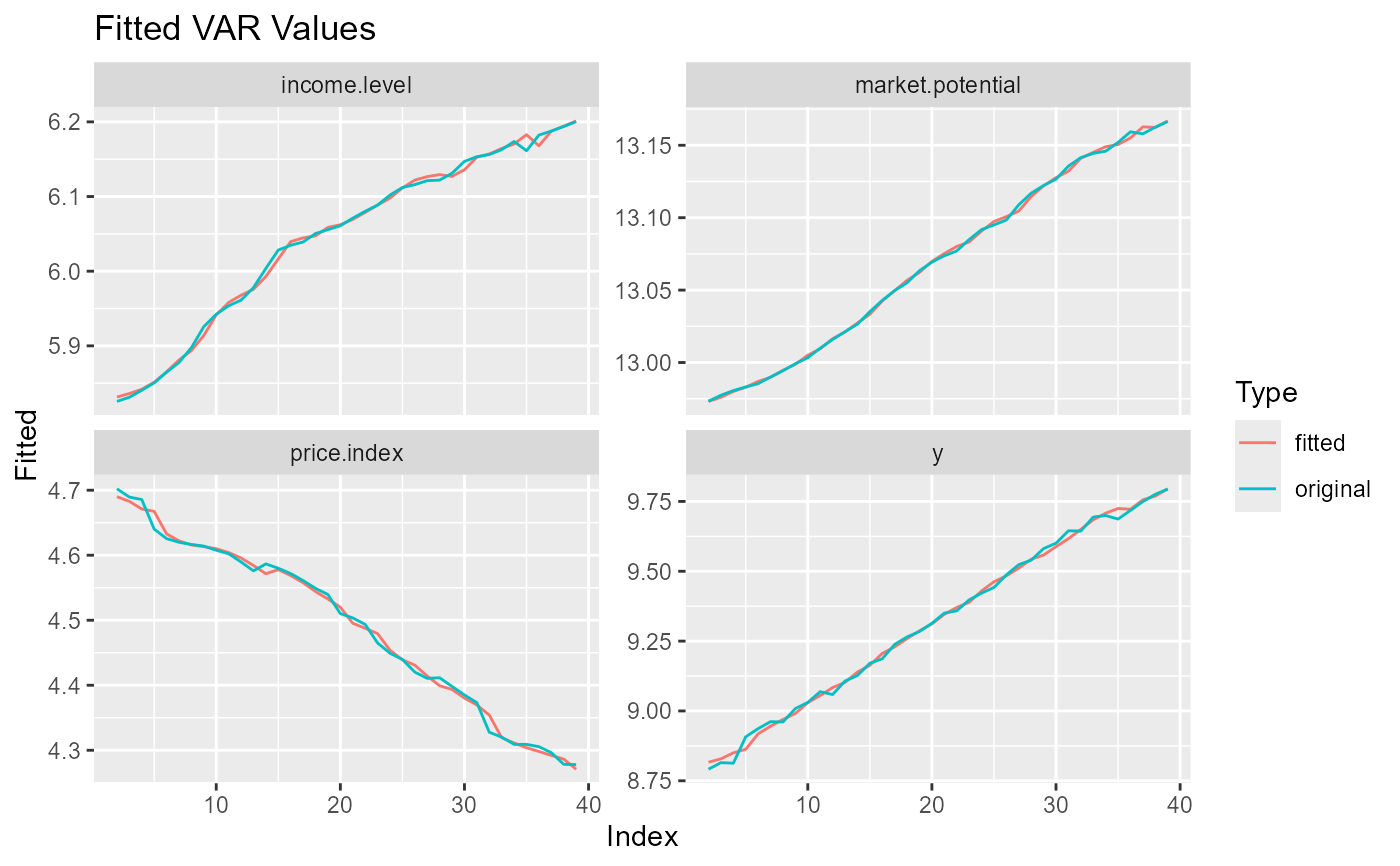
Plots fitted values of a VAR model, versus the actual values.
ggvar_fit Plots each serie in a facet. ggvar_fit_colored
plots all in the same graph, each with a different color.
Arguments
- x
A "varest" object to get fitted values from.
- series
A character vector with series (variables) to consider. Defaults to all (
NULL).- index
A vector of labels to the x-axis, normally dates. Must have length equal to
x$obs. Defaults to a integer sequence.- args_aes
Defines aesthetics to differentiate the data. A named list of aesthetics names (
*) – arguments passed toggplot2::scale_*_manual. See more in the 'Customization' section.- args_line
Additional arguments passed to geom_line (respectively). See more in the 'Customization' section.
- args_labs
Additional arguments passed to labs. If an empty list, will be changed to default values.
- args_facet
Additional arguments passed to the faceting engine used.
- ...
Arguments passed to methods, see the 'Methods' section.
Value
A ggplot.
Details
Customization
The graph can be customized both with the 'static' arguments passed to each layer – using the args_* arguments –, and, if applicable, the 'dynamic' aesthetics – using the args_aes argument.
The args_aes is a list with '* = arguments to scale_*_manual \
elements, where '*' represents the name of an aesthetic to apply to the \
data. View vignette('ggplot2-specs', 'ggplot2') to see the available \
aesthetics.
After built, the result can be further customized as any ggplot, adding or overwriting layers with the ggplot's +. It is useful to understand the data and the mappings coded by the package, using the function get_gg_info.
See vignette('customizing-graphs') for more details.
See also
Other historic values plots:
ggvar_history(),
ggvar_predict()