Plots the result of a fevd call.
Arguments
- x
A "varest" object to pass to fevd, or, directly, a "varfevd" object.
- series
A character vector with series (variables) to consider. Defaults to all (
NULL).- n.ahead
An integer. The size of the forecast horizon, passed to fevd. Unused if
xis of class varfevd.- graph_type
The ggplot geom used to create the plot:
'bar', for geom_bar or'line', for geom_line.- args_aes
Defines aesthetics to differentiate the data. A named list of aesthetics names (
*) – arguments passed toggplot2::scale_*_manual. See more in the 'Customization' section.- args_type
Arguments passed to the 'geom' chosen in
graph_type.- args_labs
Additional arguments passed to labs. If an empty list, will be changed to default values.
- args_facet
Additional arguments passed to the faceting engine used.
- ...
Arguments passed to methods, see the 'Methods' section.
Value
A ggplot.
Details
Customization
The graph can be customized both with the 'static' arguments passed to each layer – using the args_* arguments –, and, if applicable, the 'dynamic' aesthetics – using the args_aes argument.
The args_aes is a list with '* = arguments to scale_*_manual \
elements, where '*' represents the name of an aesthetic to apply to the \
data. View vignette('ggplot2-specs', 'ggplot2') to see the available \
aesthetics.
After built, the result can be further customized as any ggplot, adding or overwriting layers with the ggplot's +. It is useful to understand the data and the mappings coded by the package, using the function get_gg_info.
See vignette('customizing-graphs') for more details.
Methods
The data from x is extracted with the generic function mtsdesc:::fevd_setup. Each class conditions an external function to pass the ... arguments to. Below there is a list with all the currently implemented classes:
Class
'varest': passed to vars::fevd.Class
'varfevd': passed to nothing.
See also
Other VAR output plots:
ggvar_irf()
Examples
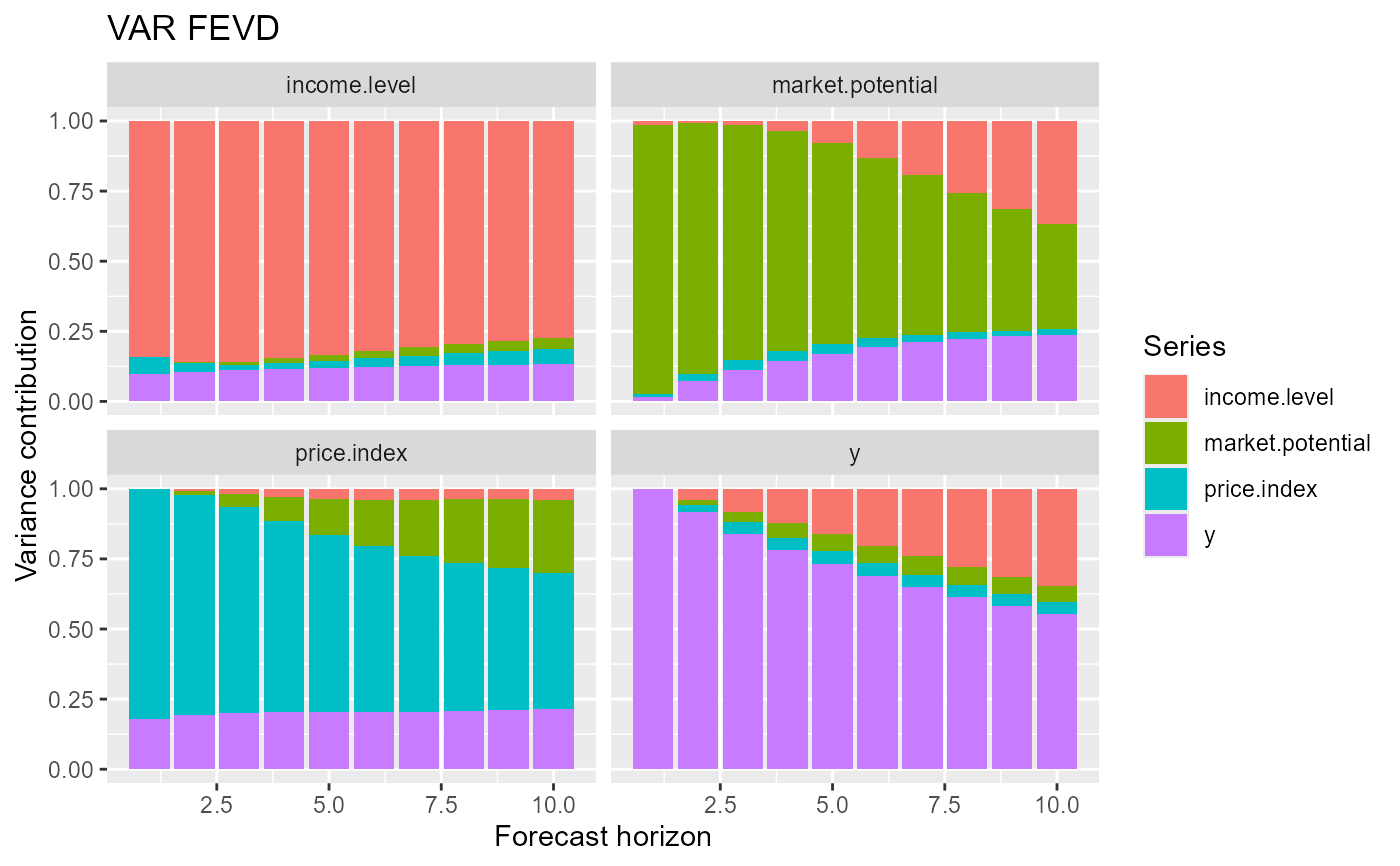
ggvar_fevd(vars::VAR(freeny[-2]), n.ahead = 10)
#> Warning: Some aesthetic must have its 'values' defined in `args_aes`. Setting
#> `args_aes$fill$values` to "'ggplot'".